QA catalogue for analysing library data
British Library last data update: 2020-11-26 number of records: 18,787,911
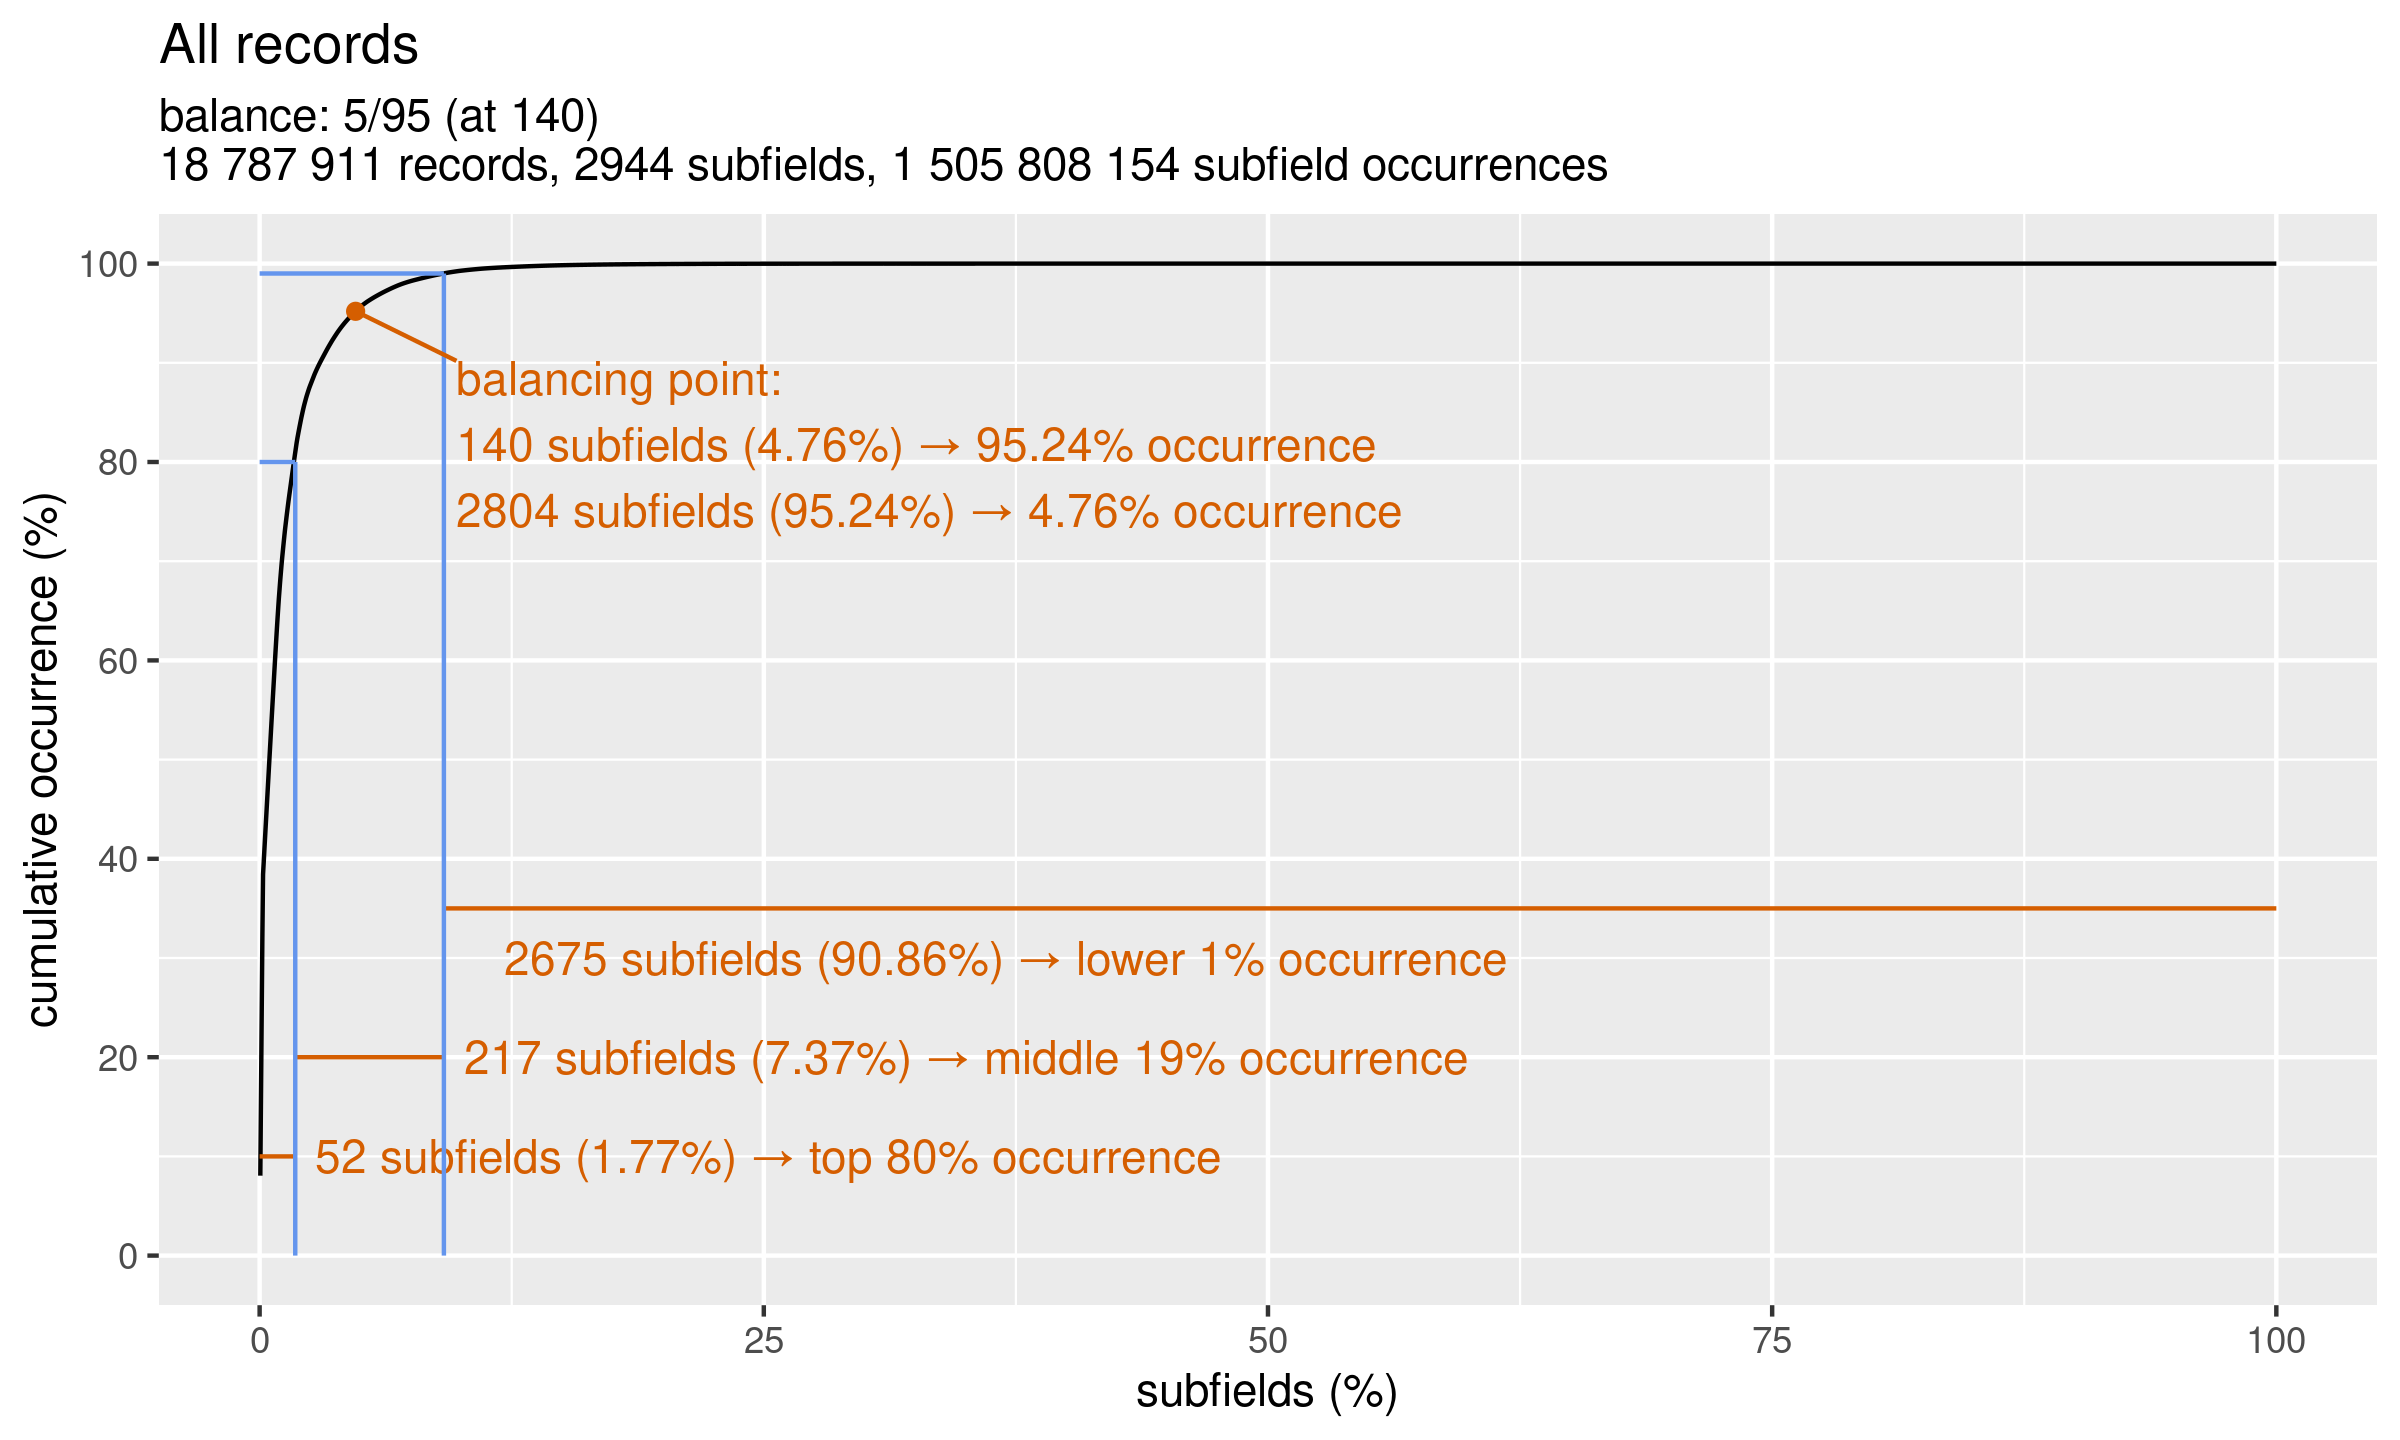
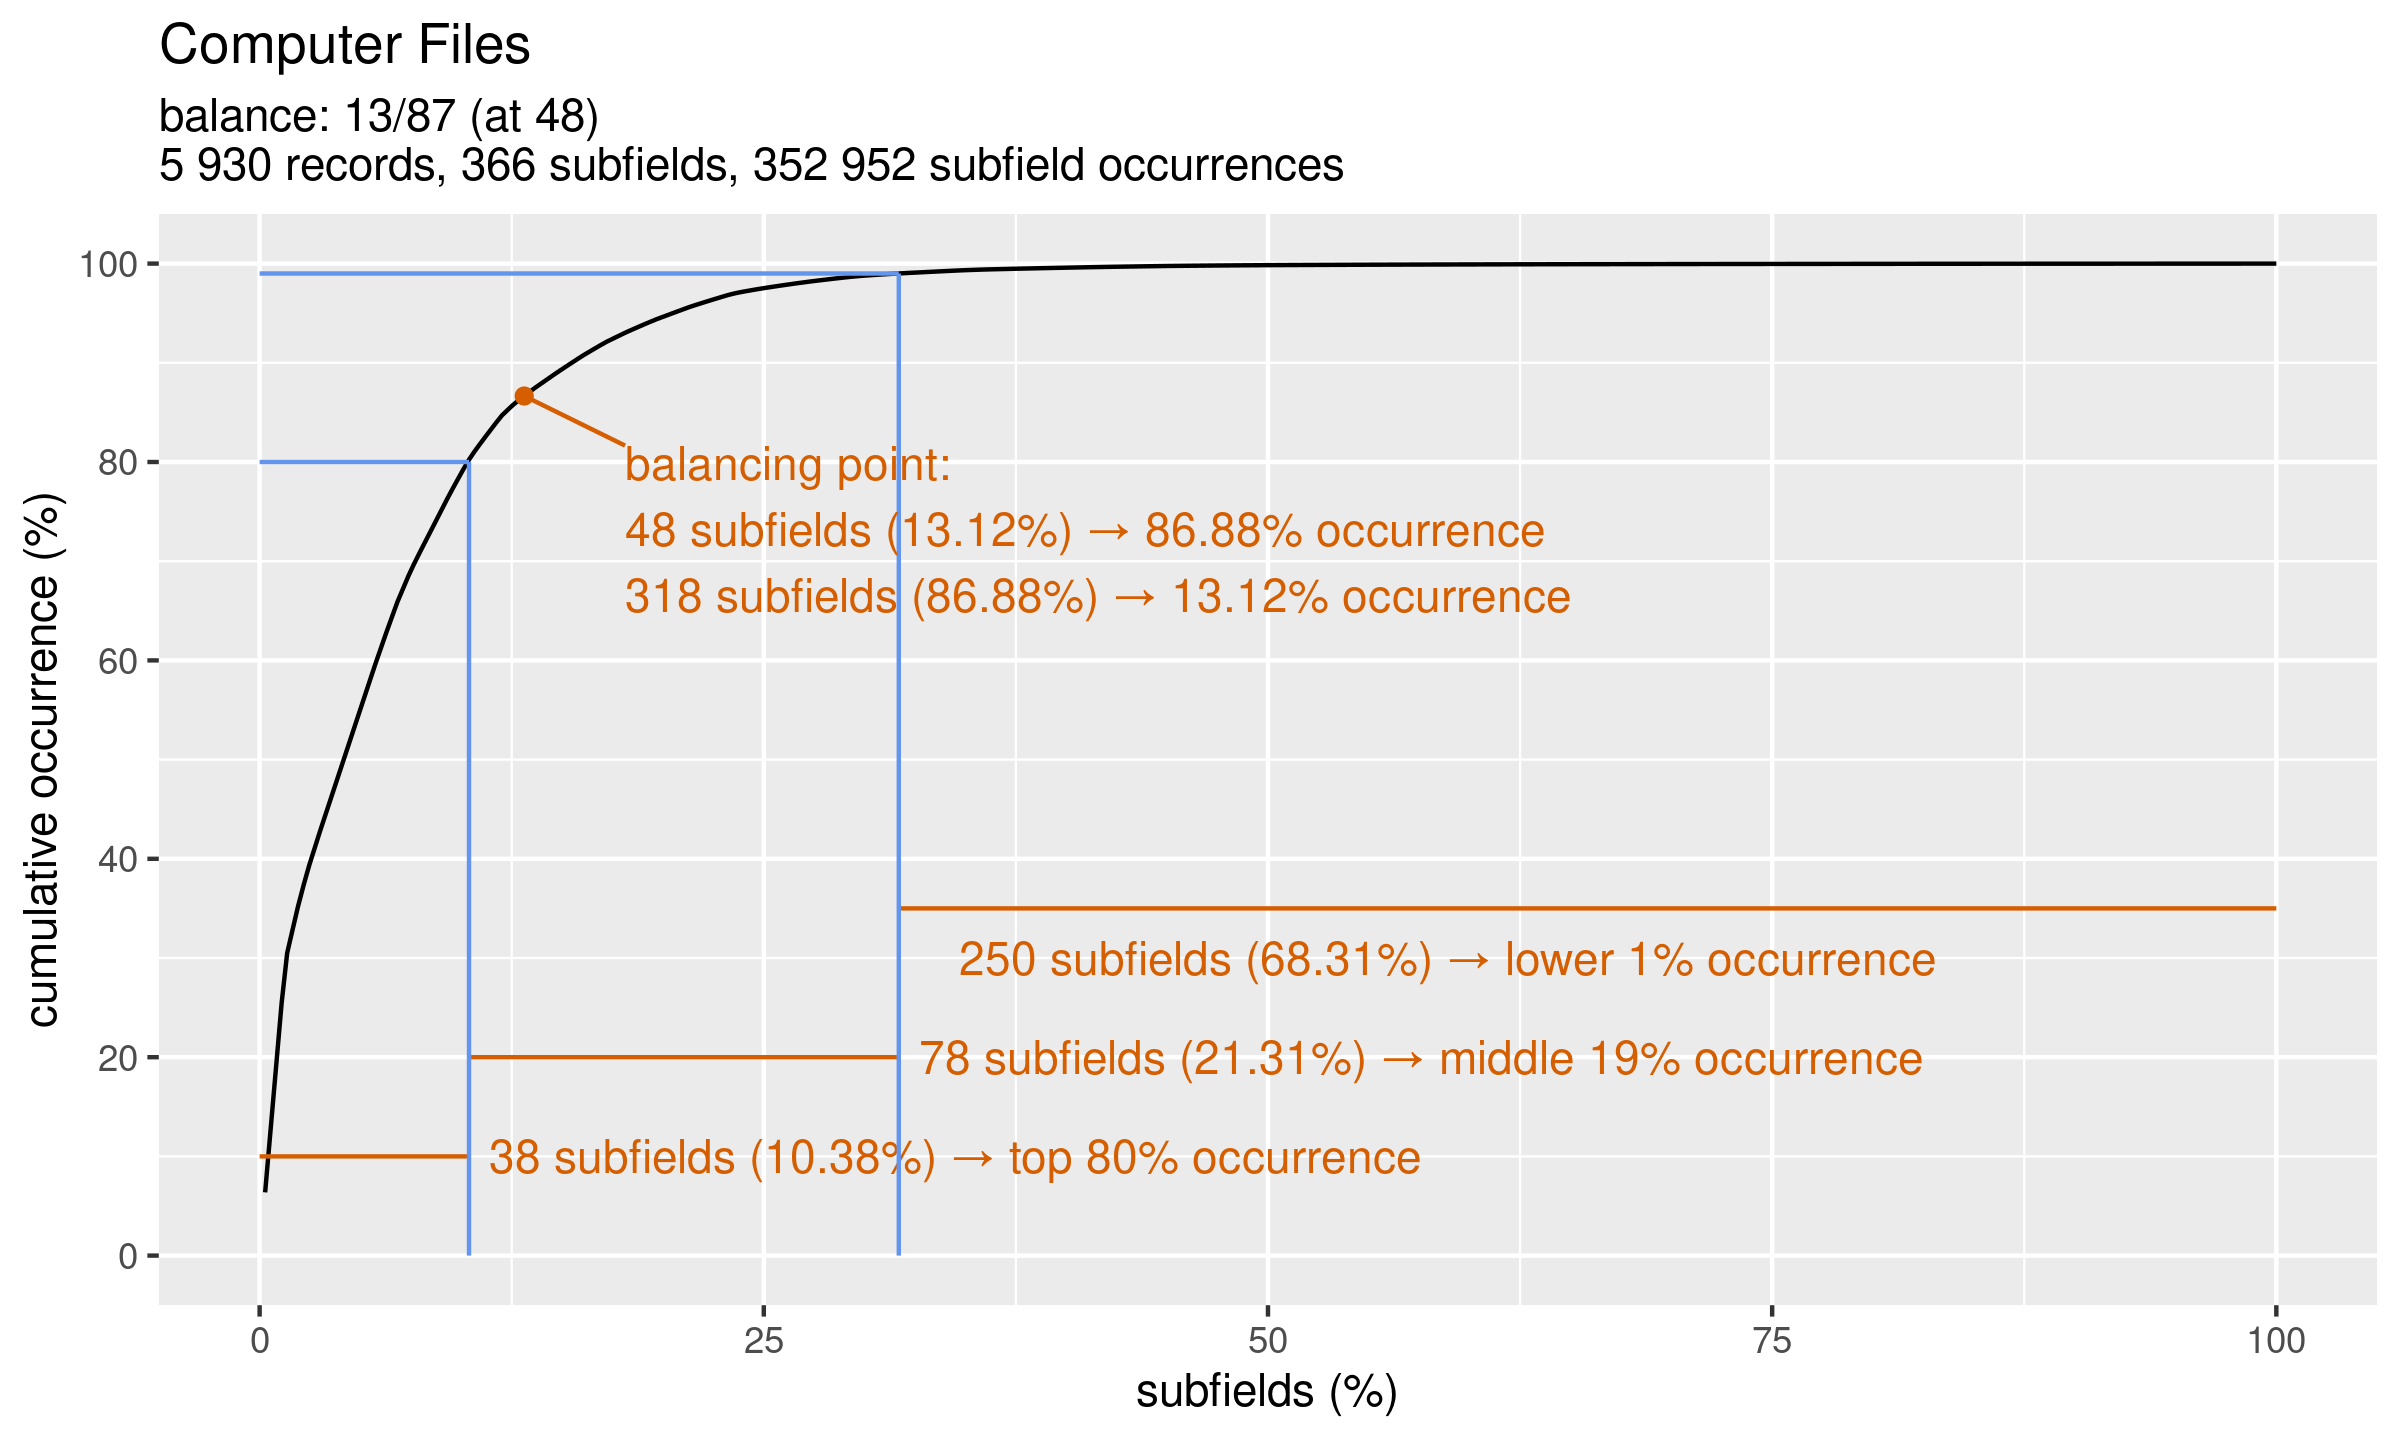
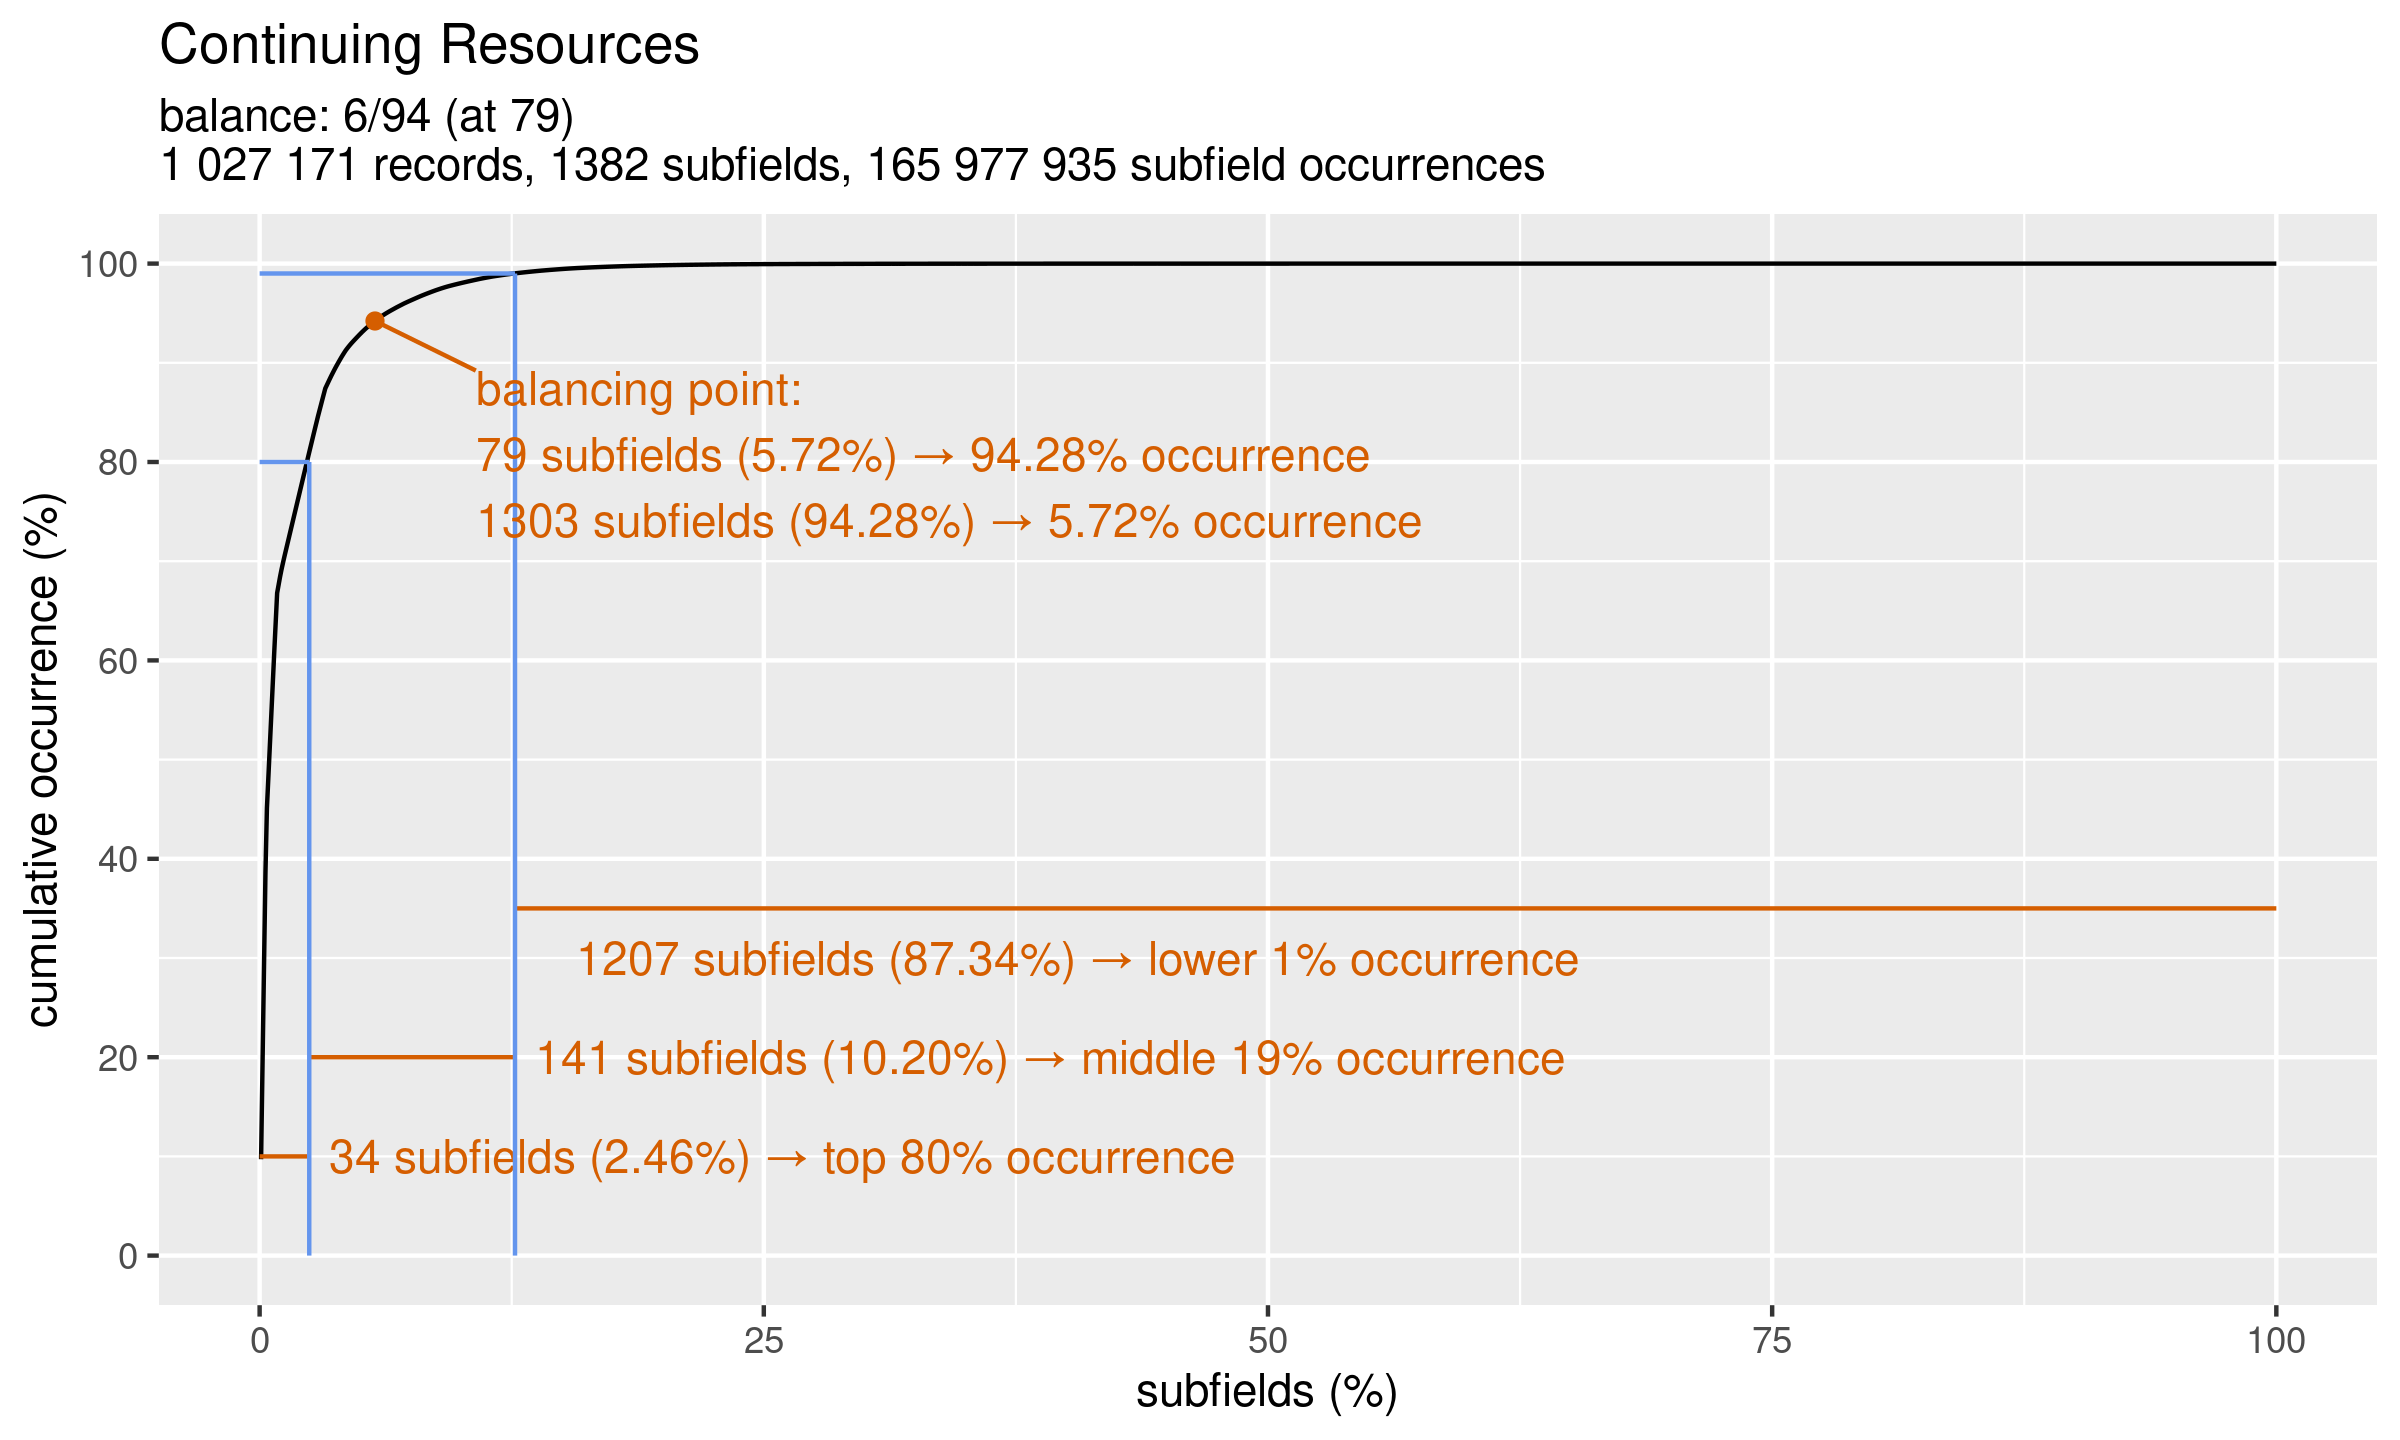
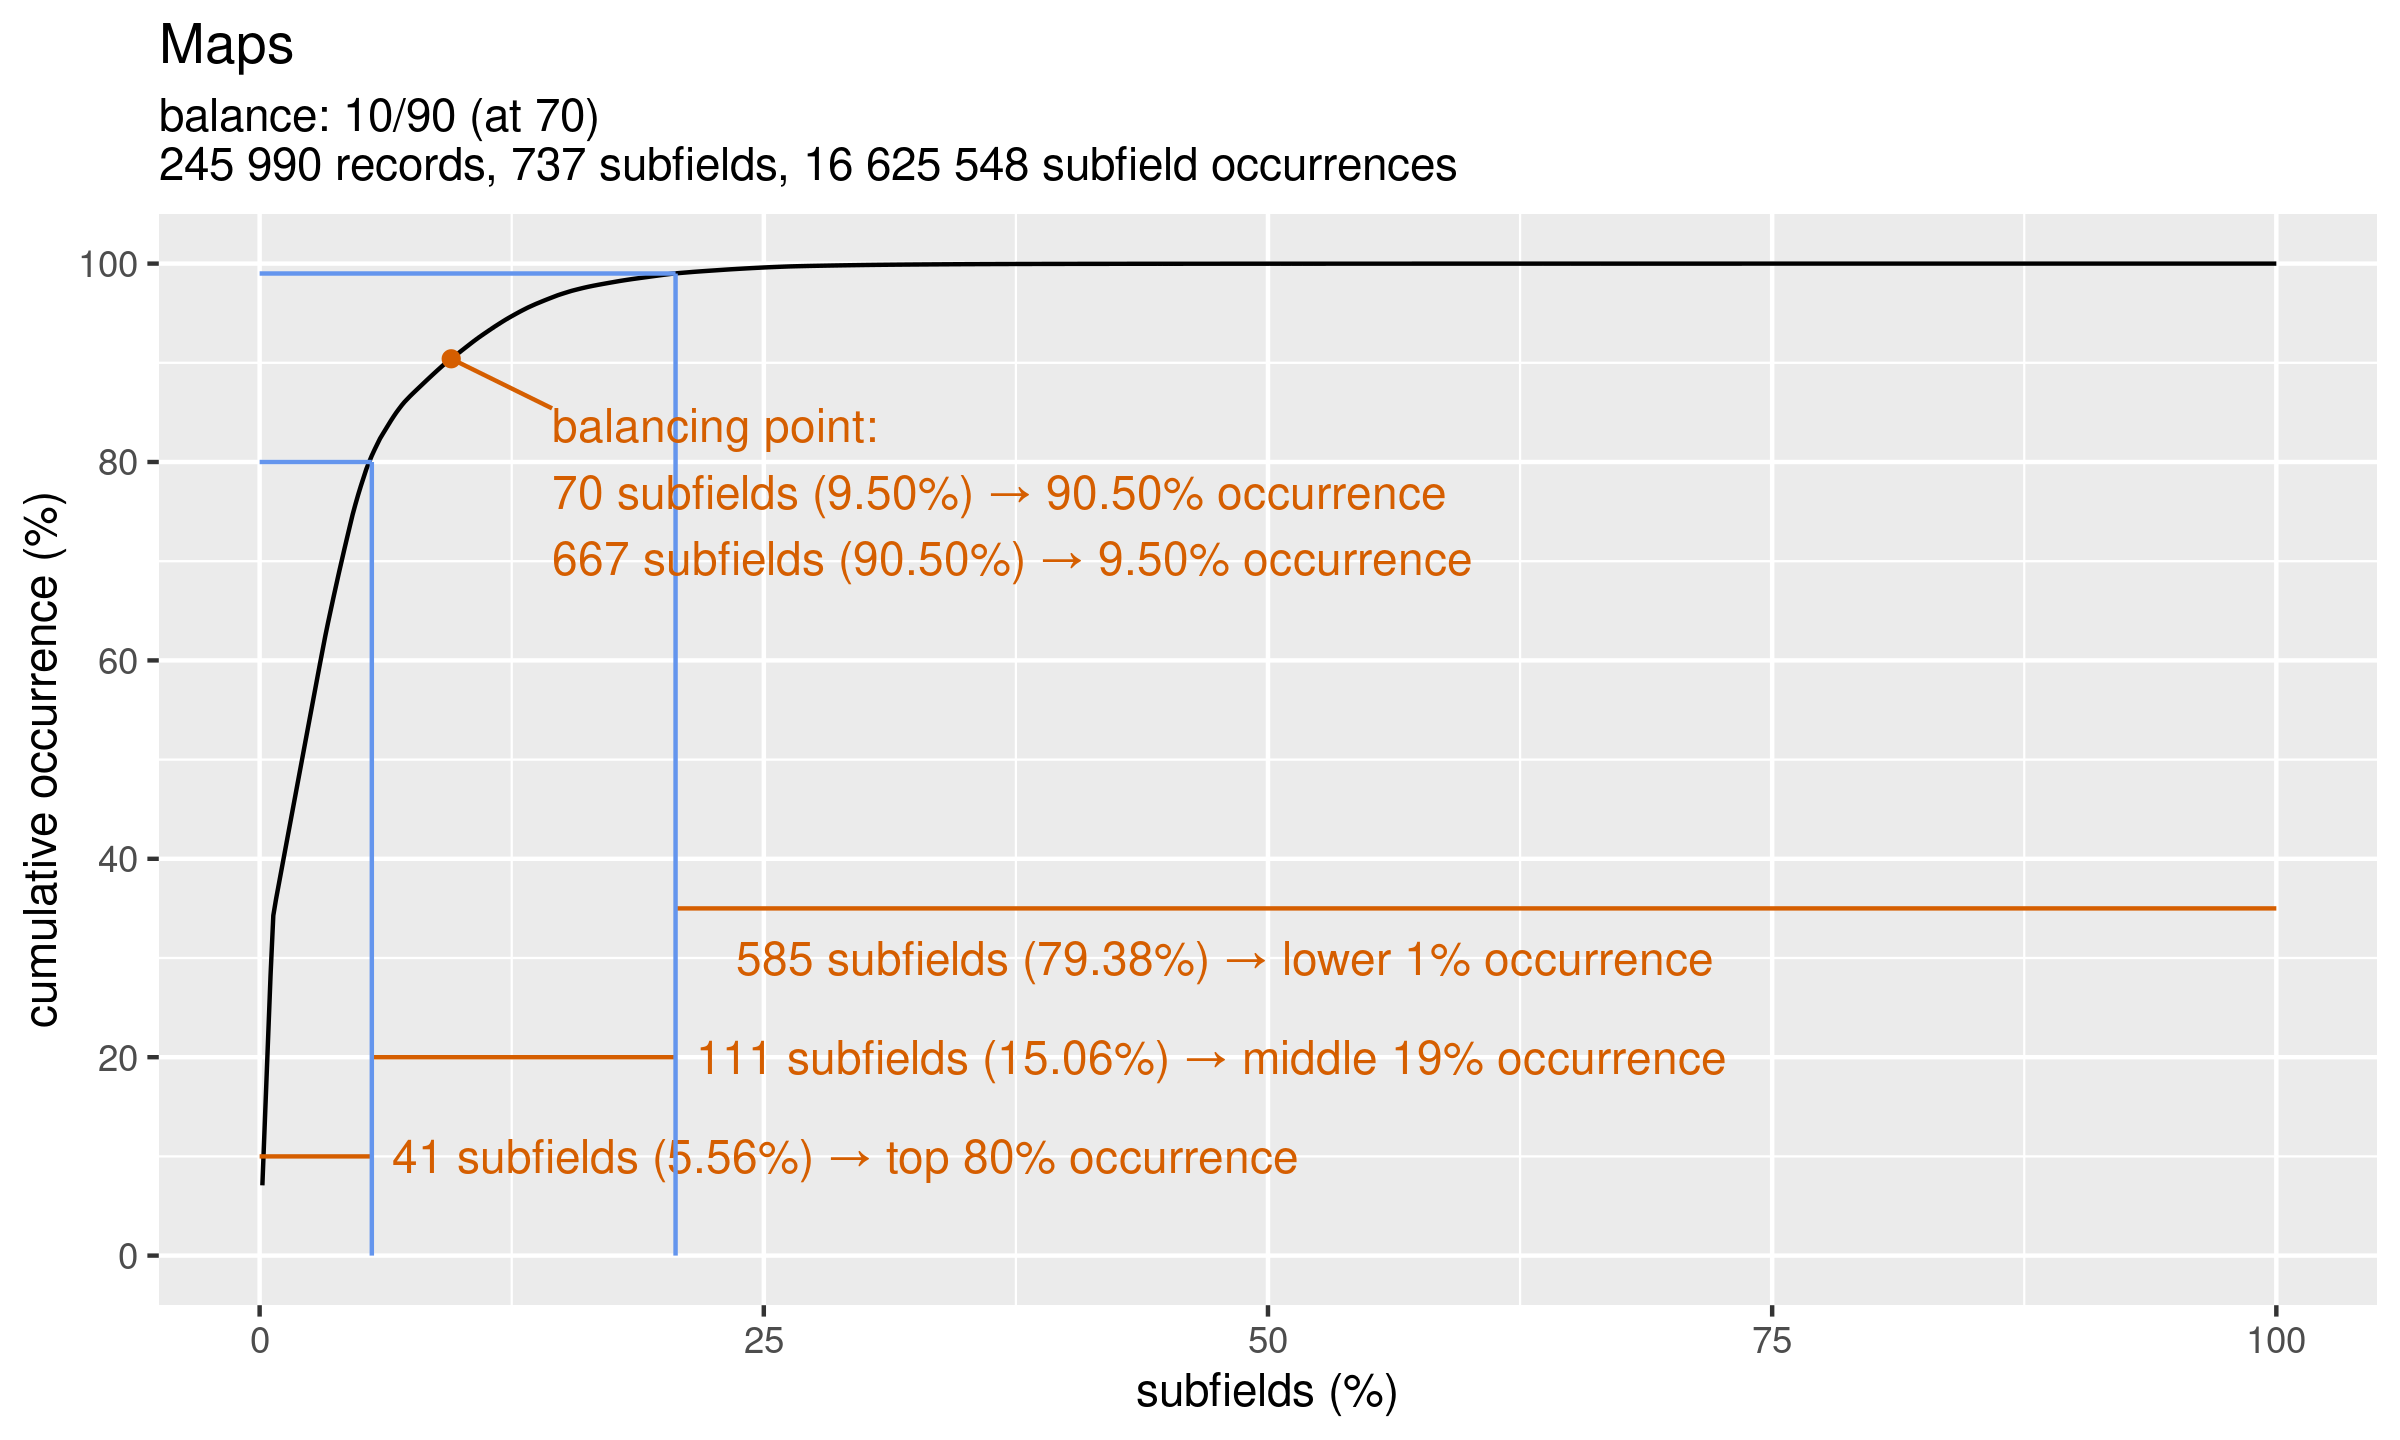
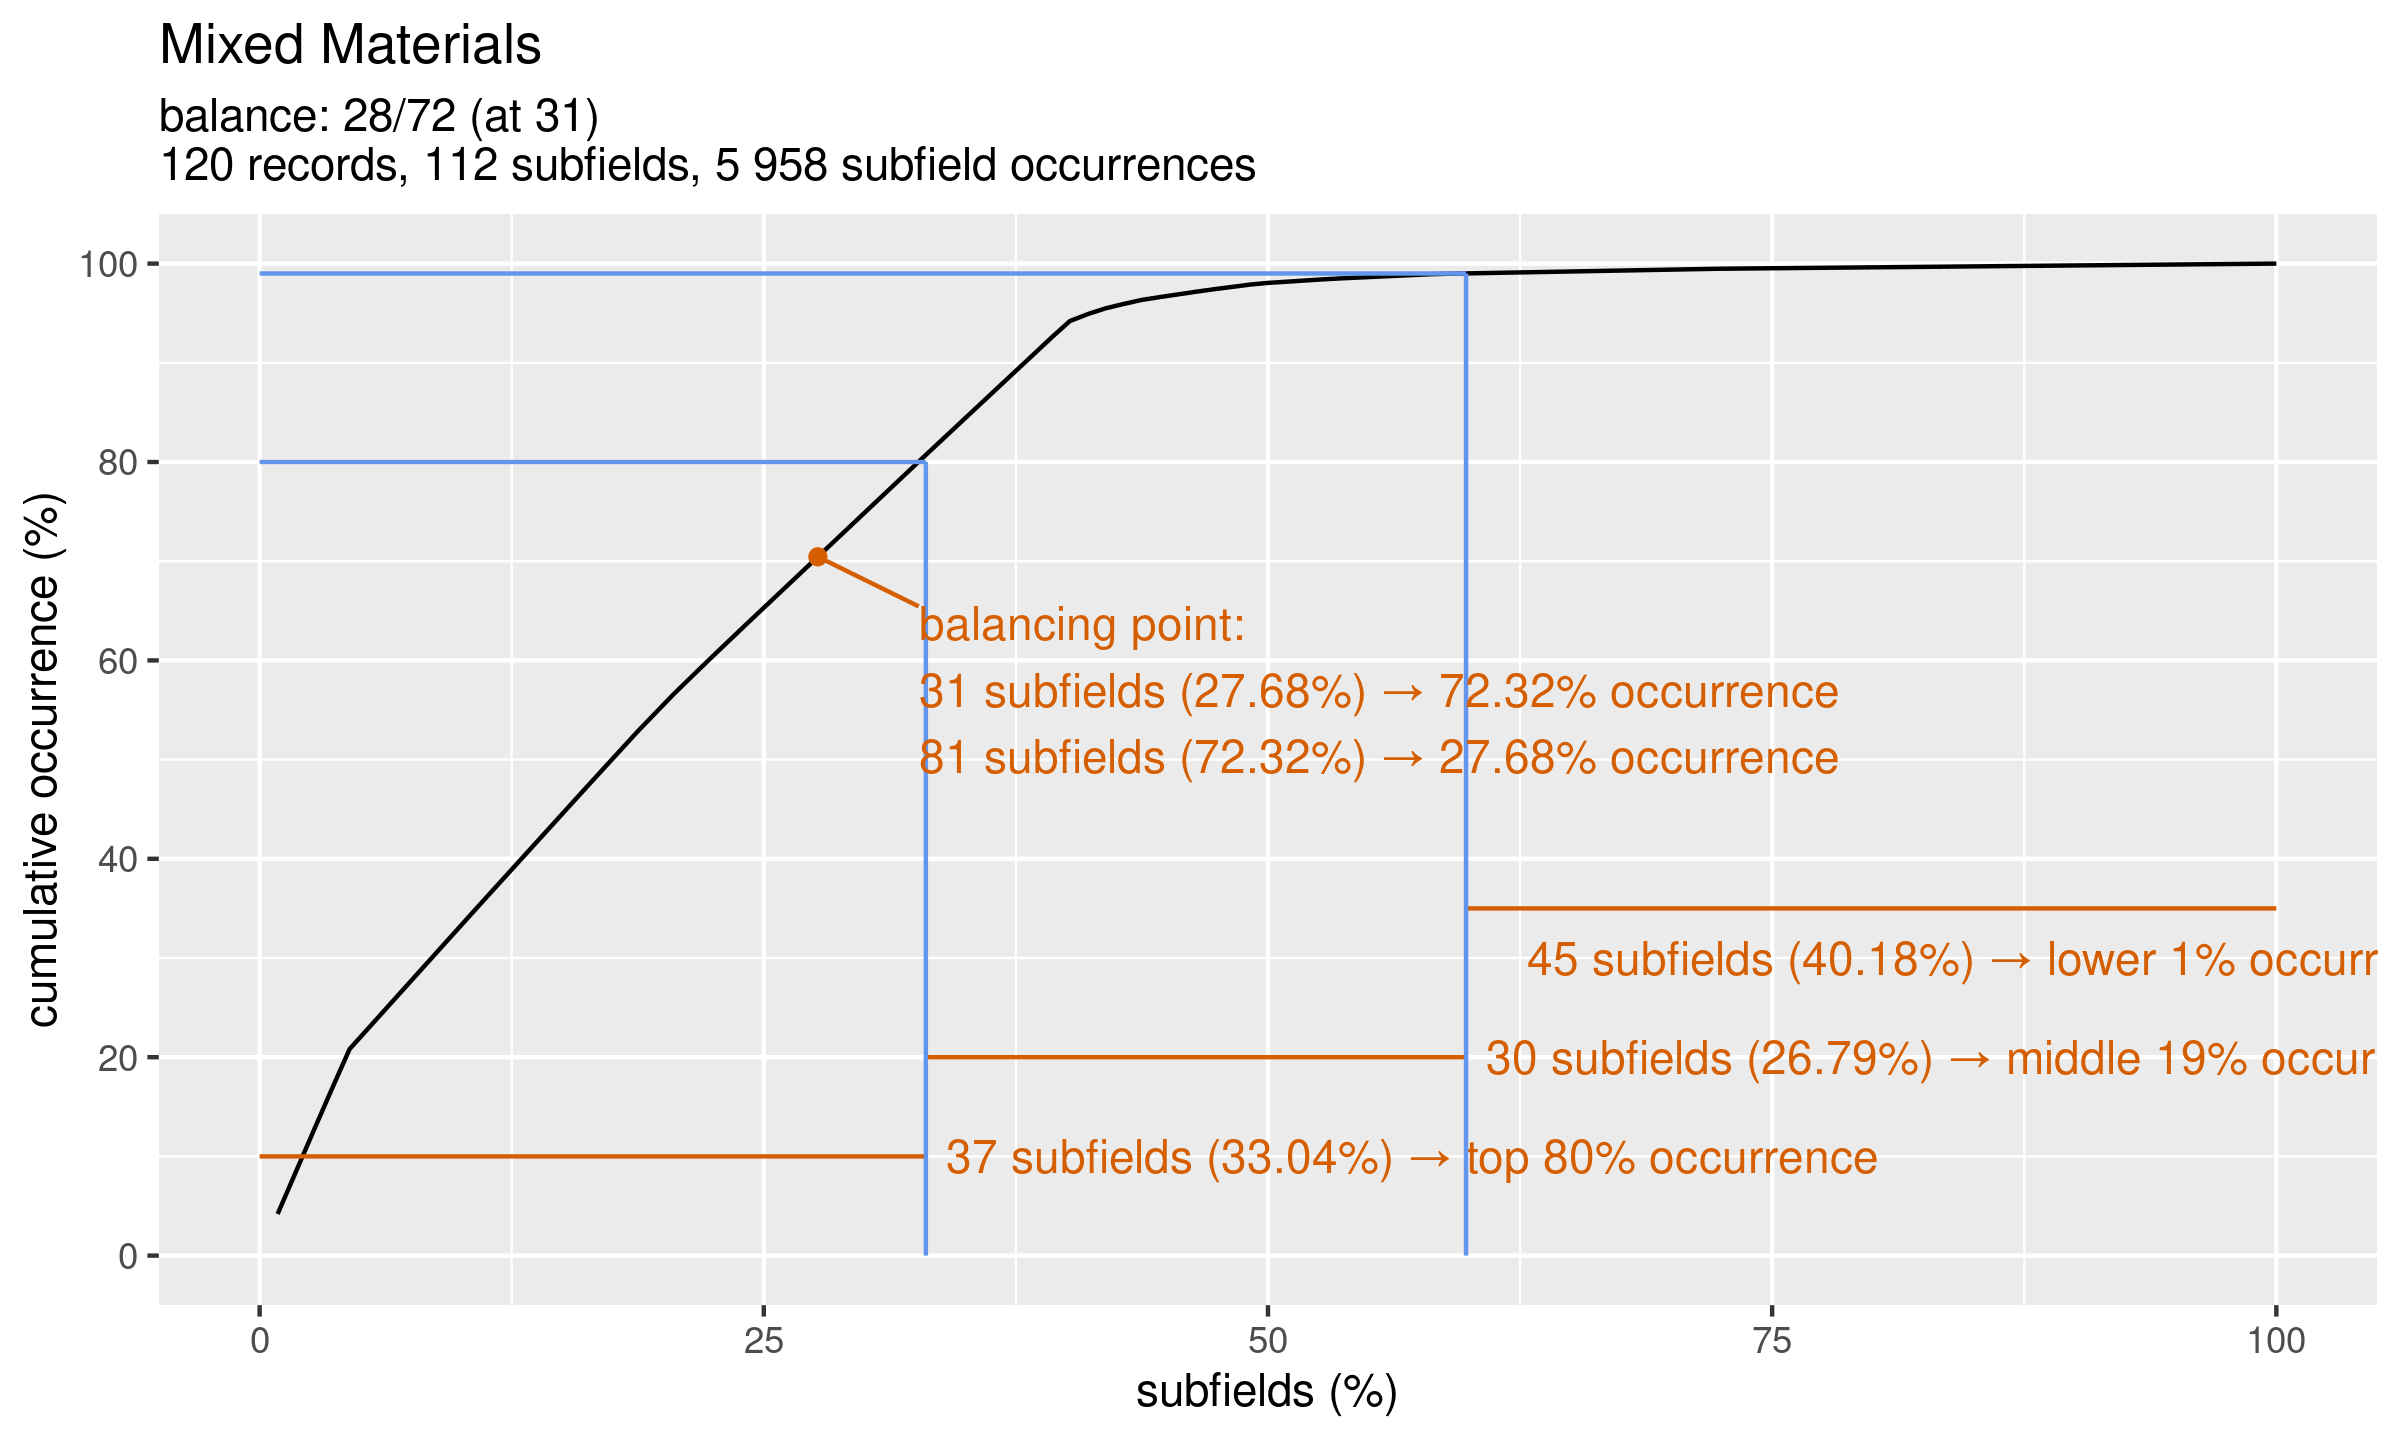
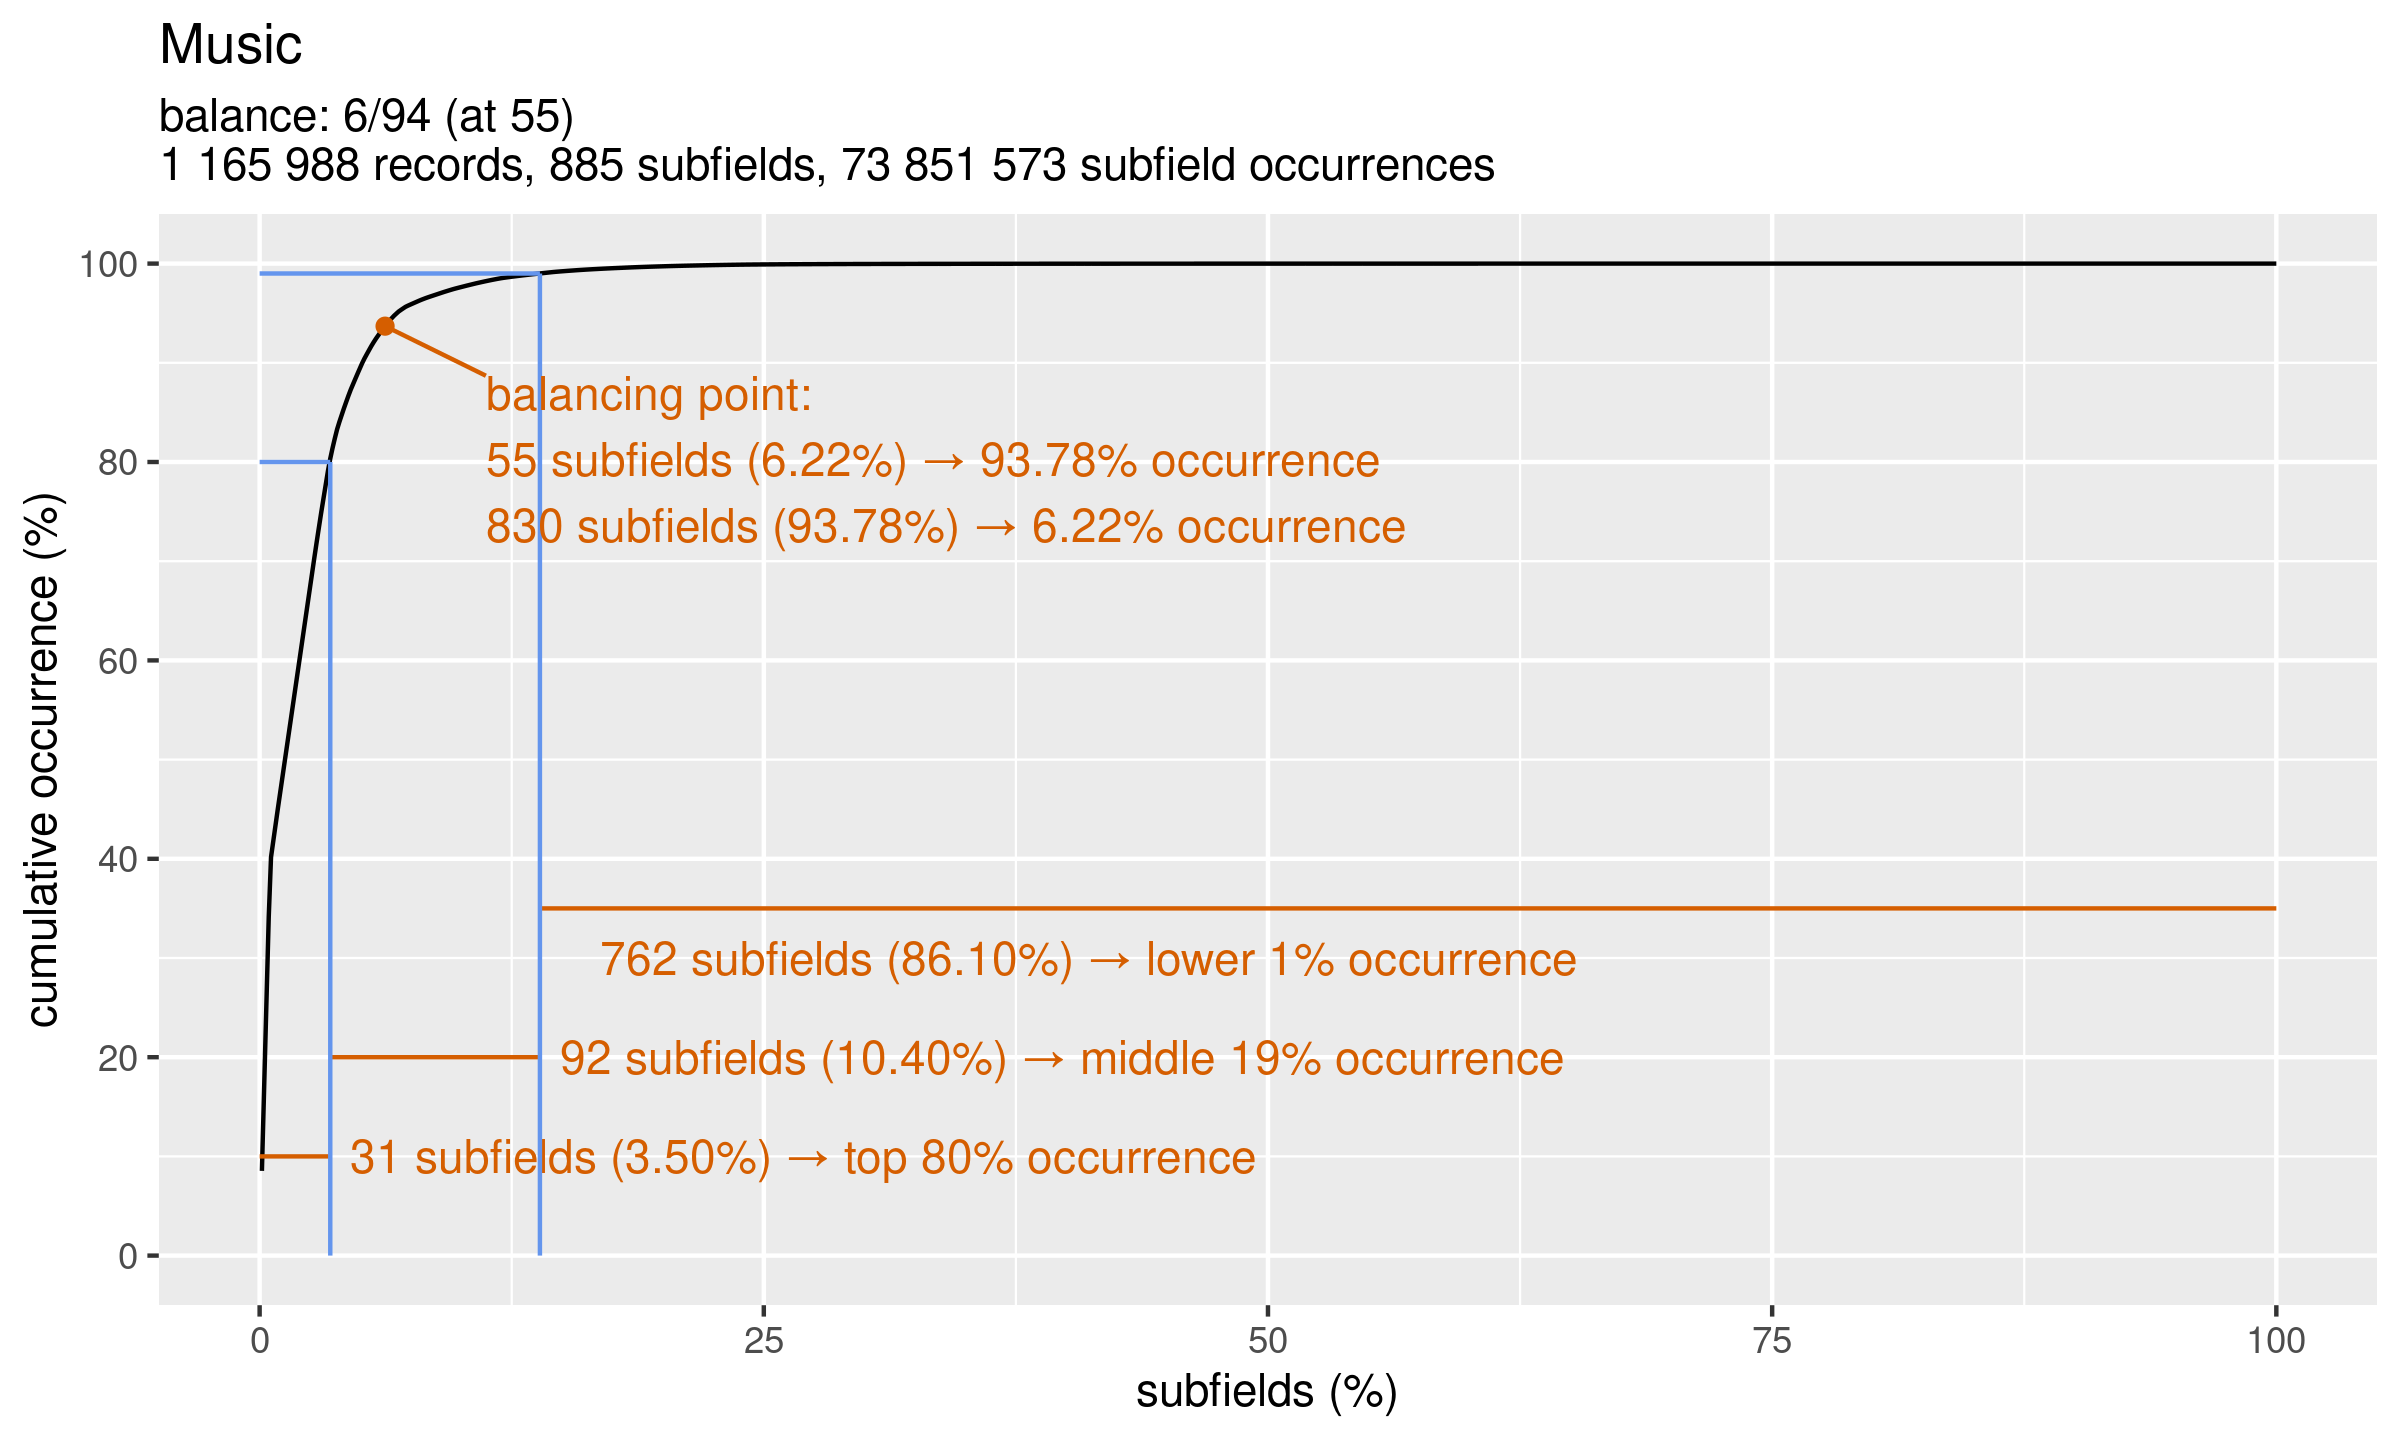
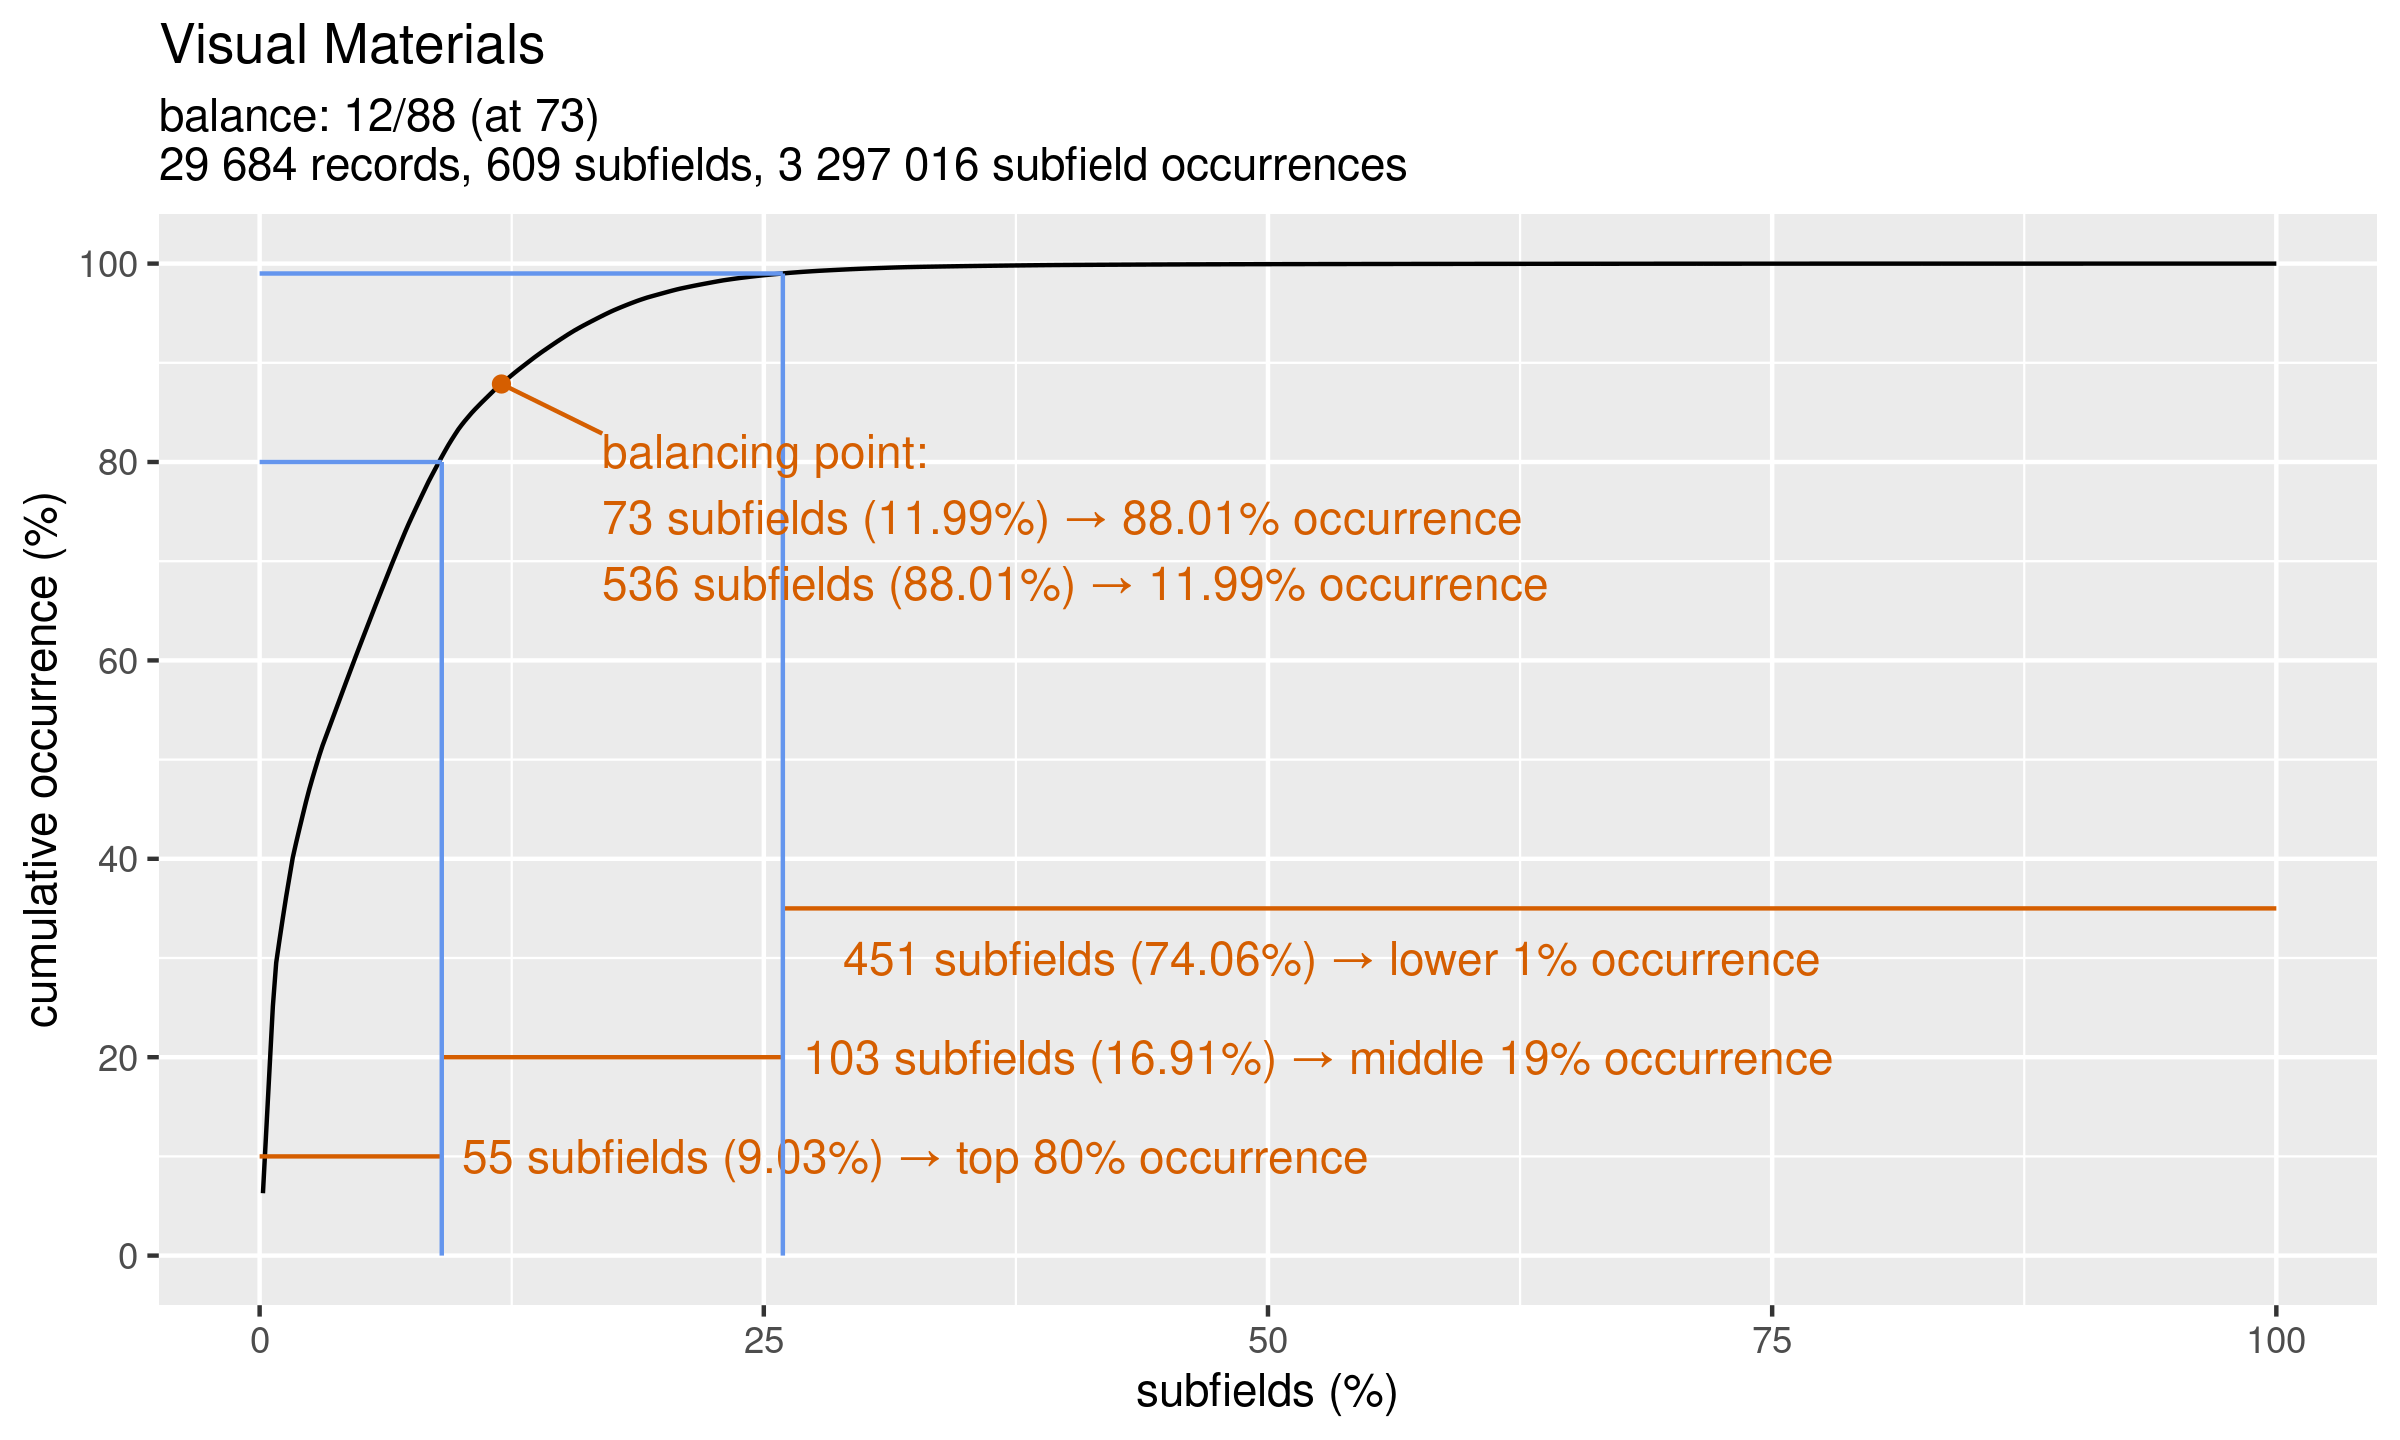
Field frequency distribution
These charts show how the field frequency patterns. Each chart shows a line which is the function of field frequency: on the x axis you can see the subfields ordered by the frequency (how many time a given subfield occured in the whole catalogue). They are ordered by frequency from the most frequent top 1% to the least frequent 1% subfields. The Y axis represents the cumulative occurrence (from 0% to 100%).